Isoelectric Point Calculator 2.0
Prediction of isoelectric point and pKa dissociation constants using deep learning
Isolectric point prediction accuracy on leave-out 25% datasets
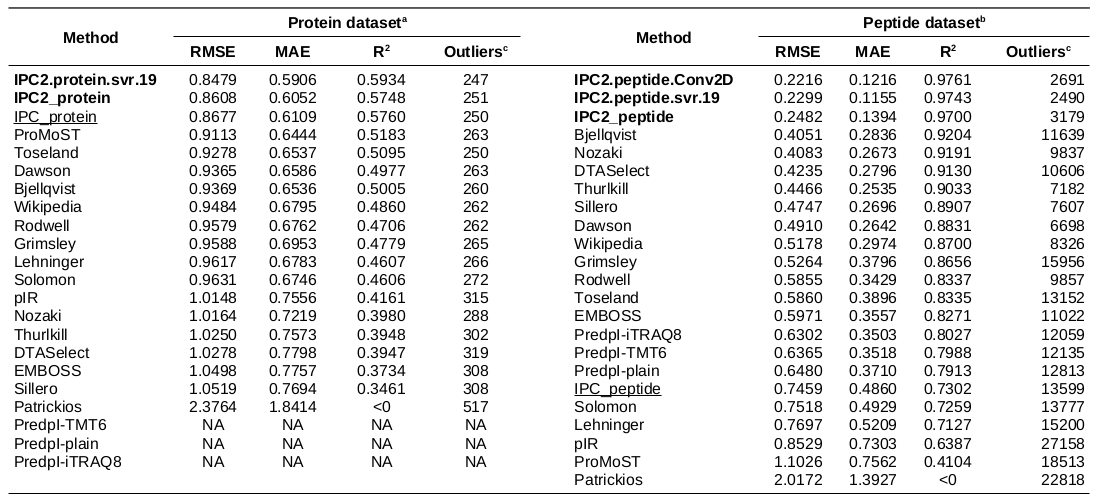
a - Protein dataset consisting of 581 proteins (25% randomly chosen proteins, not used for the training or optimisation).
b - Peptide dataset consisting of 29,774 peptides (25% randomly chosen peptides, not used for the training or optimisation).
c - The outliers are defined at 0.5 pH unit difference between the predicted and experimental pI threshold for the protein and peptide datasets.
NA: The PredpI program was designed for peptides only within the 3.7–4.9 pH range; thus, for proteins, it returned 0 and could not be evaluated on the protein dataset.
The DL models developed in this study are in bold. First version of IPC (Kozlowski, 2016) are underscored.
Table is sorted by RMSD. For individual methods’ predictions, see Supplementary Data 2 file. For more details about the datasets, see Table 1.
Conclusions: IPC2 provides new, more accurate and robust machine learning models customized for proteins and peptides.
Isolectric point prediction accuracy on training datasets (with 10-fold cross-validation)
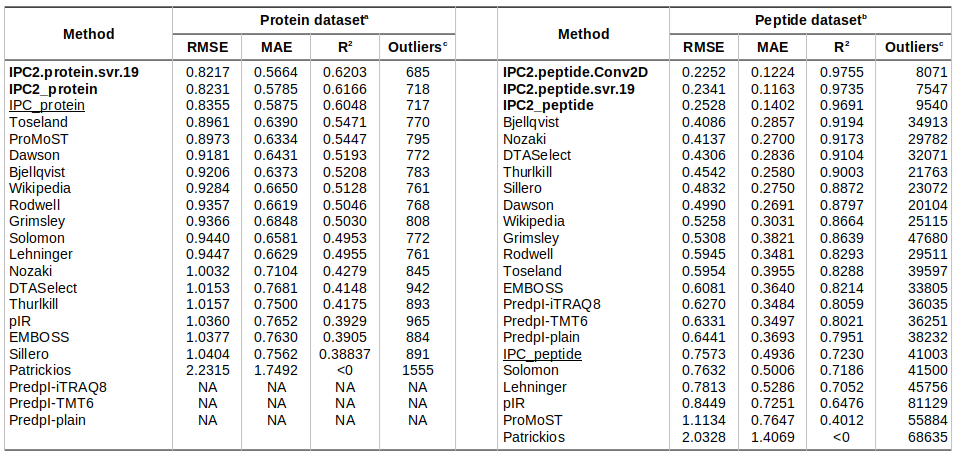
a - Protein dataset consisting of 1,743 proteins (75% randomly chosen proteins, not used for the training or optimisation).
b - Peptide dataset consisting of 89,318 peptides (75% randomly chosen peptides, not used for the training or optimisation).
c - The outliers are defined at 0.5 pH unit difference between the predicted and experimental pI threshold for the protein and peptide datasets.
NA: The PredpI program was designed for peptides only within the 3.7–4.9 pH range; thus, for proteins, it returned 0 and could not be evaluated on the protein dataset.
The DL models developed in this study are in bold. First version of IPC (Kozlowski, 2016) are underscored.
Table is sorted by RMSD. For individual methods’ predictions, see Supplementary Data 2 file. For more details about the datasets, see Table 1.
pKa prediction accuracy on Rosetta pKa dataset (test set)
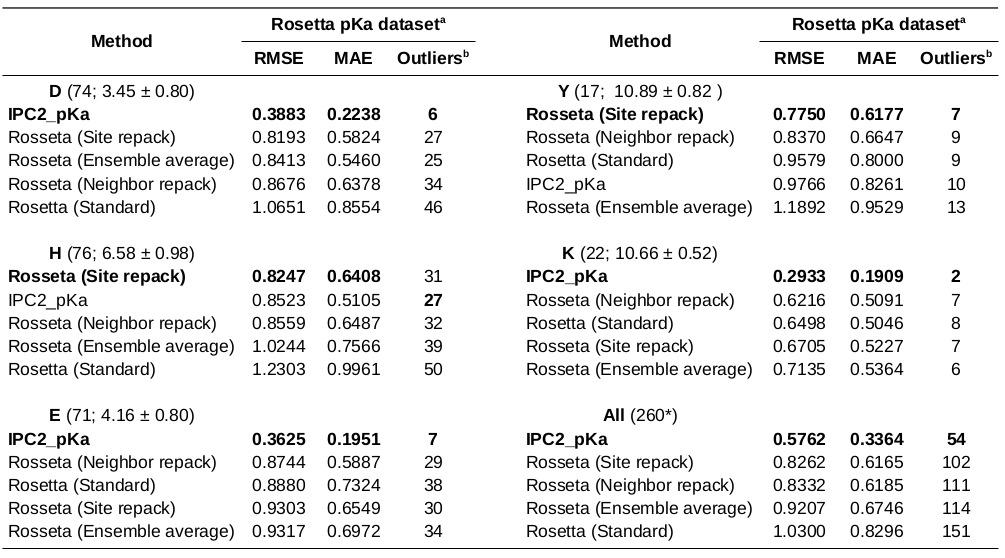
b - The outliers are defined at 0.5 pH unit difference between the predicted and experimental pKa threshold.
* - The dataset consists of 260 instead of 264 residues due to parsing problems (four missing residues could not be mapped to the protein sequence, wrong residue register).
Conclusions: The pKa prediction accuracy using IPC2_pKa model is in comparable range to the Rosseta-based approach, yet IPC2_pKa return the predictions within seconds and uses only sequence information.
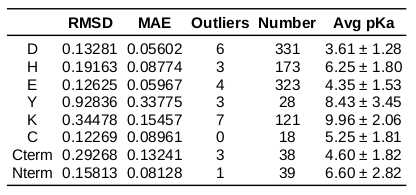
pKa prediction accuracy on PKAD dataset (1075 charged residues) - train set
Contact: Lukasz P. Kozlowski