Isoelectric Point Calculator 2.0
Prediction of isoelectric point and pKa dissociation constants using deep learning
Input
The input should be ONE sequence in plain text or MULTIPLE protein or peptide sequences in FASTA format. The upper limit is set to 75,000 amino acids or 1250 peptides (max. 60 aa each) or 25 proteins (max. 3000 aa each). If the input contains at least one sequence >60 aa, the whole input is considered "protein" and 25 sequence quota is applied. Note that the limit is calculated as "lower bound" i.e. only 25 proteins are processed, even if they are (much) shorter than 3000 aa.The input should be in single-letter amino acid code, it can be upper or lower case. Amino acid alphabet allowed: VXCDBFMOLNYIQTGHWESKPAUR. All non-amino acid characters will be removed from the sequence.
Output & interpretation
The aim of the IPC2 is to predict isoelectric point and pKa values given the amino acid sequence.In the first panel, you obtain an interactive, virtual 2D-PAGE plot (isoelectric point vs. molecular weight). If you point a mouse on any dot you will get the fasta header of given sequence and prediction score). This is a highly useful plot if you analyze the protein lysate (it will give you a good estimate where the protein of interest should be located on the gel). Below, the plot for complete proteome (191 proteins) of Actinospica robiniae DSM 44927 (fasta file).
Next, you have a panel with the prediction of isoelectric point for individual peptides/proteins using different models.
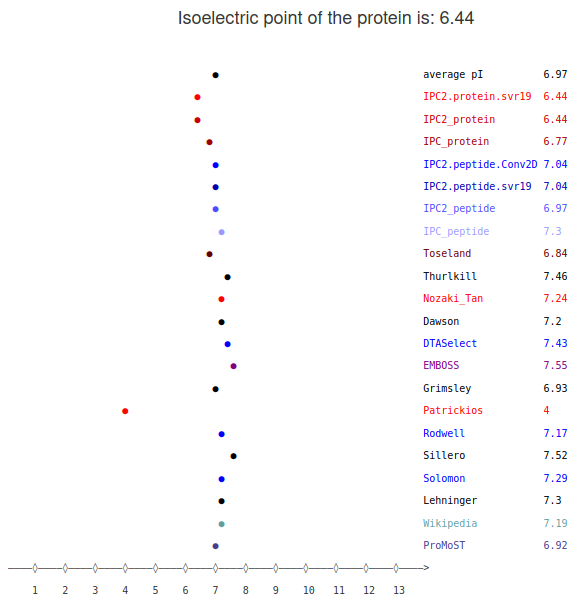
Here, you need to know that the choice of the model also depends on the data type. There are different machine learning models trained for the peptides and proteins. This is because those two types of data differ significantly. In the peptides you have less charged residues, additionally you do not need to consider such things as the location of the charged residue - is it on surface contributing to the molecule charge or is it inside of the protein and might the charge be "neutralized".
For peptides (e.g. for mass spec) it is recomended to use:
- IPC2.peptide.Conv2D (the most advanced, deep learning model) RMSD 0.222
- IPC2.peptide.svr19 (simpler, support vector regression, but also very effective) RMSD 0.230
- IPC2_peptide (model based on differential evolution optimisation) RMSD 0.248
Note: it is no longer recommended to use IPC peptide, as the dataset used for getting this model has been corrupted
For proteins (e.g. for 2D-PAGE) it is recomended to use:
- IPC2.protein.svr.19 (support vector regression) RMSD 0.848
- IPC2_protein (model based on differential evolution optimisation) RMSD 0.861
- IPC2_protein (model based on basin-hopping optimisation) RMSD 0.868
Additionally you will get predictions of pKa values of all individual charged residues. Note, that the pKa models had been trained on the proteins, thus there are meaningless for the peptides (<60aa).
Input sequence:
>tr|W9DVW5|W9DVW5_9ACTN Uncharacterized protein OS=Actinospica robiniae DSM 44927 GN=ActroDRAFT_0006 PE=4 SV=1
MpKa = 6.93545 T A T P RpKa = 11.99188 S RpKa = 11.99340 A EpKa = 4.12942 I V G DpKa = 3.32548 T A I A V L A A Q G A RpKa = 11.88105 G L T HpKa = 6.55317 RpKa = 11.96631 A V DpKa = 3.37898 RpKa = 11.92598 A A G L P P G S T S N HpKa = 6.54304 A RpKa = 12.01048 T RpKa = 12.00426 EpKa = 4.13095 A L L T CpKa = 8.21753 A L T RpKa = 11.98185 I T EpKa = 4.14257 L EpKa = 4.08674 A A DpKa = 3.29137 A A A A T A G Q P V F DpKa = 3.38440 T G G DpKa = 3.35726 V RpKa = 11.94923 T A L A A P I A A M L YpKa = 10.89975 RpKa = 11.99579 G L S RpKa = 11.97019 G RpKa = 12.01436 T RpKa = 12.02449 L L A RpKa = 12.01900 YpKa = 10.90900 EpKa = 4.17900 L A L EpKa = 4.07745 S T RpKa = 11.99188 RpKa = 11.97949 P A L RpKa = 11.93535 A L YpKa = 10.87718 DpKa = 3.44018 EpKa = 4.12699 A S L P F RpKa = 11.95857 G P V A A M L A A S G S A EpKa = 4.08595 P Q RpKa = 11.98567 HpKa = 6.58571 A KpKa = 10.63877 M L I A W CpKa = 8.25233 EpKa = 4.13405 G V Q F DpKa = 3.42704 A I A G A G A A T P P A EpKa = 4.07432 A EpKa = 4.15263 L RpKa = 11.96009 T G L EpKa = 4.10846 EpKa = 4.15190 L L RpKa = 11.97103 G M L G T G RpKa = 11.93990 EpKa = 4.08904 S S A I Q G V DpKa = 3.39582 RpKa = 11.43294
Moreover, at the bottom, you can get csv file with all predictions of your input ("Download results in CSV format" button). Each line correspond to single query sequence and the columns are:
"fasta_header,sequence,molecular_weight,average_pI,IPC2.protein,IPC2.peptide,Toseland,...,pH_5.5_charge pH_7.4_charge,pH_8.0_charge,pKas"
Where "pKas" dissociation constant field looks like:
K5_10.43;H17_6.54;R55_11.99,..which means Lys at 5th position has pKa of 10.43, His at 19th position has pKa of 6.54, Arg at 55th position has pKa of 11.99 and so on.
Note, that pKa values prediction is based solely on sequence information, thus it may not be as accurate as using Rosseta pKa protocol or H++ (for benchmarks see Results section). Yet, IPC2 provides pKa estimates in a fraction of seconds in high-throughput fashion while other methods require the structure/model of the protein and run for hours in comparison.
Browser compatibility
| OS | Version | Chrome | Firefox | Opera | MS Edge | Safari |
| Linux | Ubuntu 18.04.3 LTS | 78.0.3904.97 | 70.0.1 | 64.0.3417.92 | n/a | n/a |
| MacOS | Catalina 10.15.1 | not tested | not tested | not tested | n/a | 13.0.3 |
| Windows | 10 | 78.0.3904.108 | 70.0.1 | 65.0.3467.48 | 44.17763.831.0 | n/a |